TakeawayDiversification, not the choice of system, carries the Turtle rules; the edge weakened after 2005, and the best single markets are the hardest to trade at size.
The Original Turtle Trading Rules are now public and free to read. In this report, I examine how these rules perform and whether their performance has degraded over time. I test the rules one market at a time on 73 futures markets and compare the performance of correlated markets, since the Turtles traded the strongest markets long and the weakest short. Assuming trading starts at the beginning of 1994, the strategy makes money in most markets, but single markets are noisy: the median market earns a Sharpe ratio of only 0.20. An equal-weight composite of all 73 markets earns a 1.26 Sharpe, against 0.41 for buying and holding the E-mini S&P 500, though its Sharpe fell from 1.67 in 1994–2005 to 0.79 in 2006–2017. Finally, I discuss the drawbacks of this implementation and how to extend it.
1. Introduction
The Original Turtle Trading Rules give comprehensive guidelines on how to run the strategy: which markets to trade, how to size positions, when to enter and exit, and where to place stops. I focus on a simple subset of these rules:
- Markets and position sizing. Deciding which markets are closely or loosely correlated takes judgment, so I trade each market on its own. Positions build to the full four Units, as the Turtles’ did.
- Entries and exits. System 1 enters on a 20-day breakout and exits on a 10-day reversal. System 2 enters on a 55-day breakout and exits on a 20-day reversal.
- Stops. I use the Turtle stop and test the Whipsaw stop as an alternative.
Beyond the rules, I make two assumptions:
- Timeframe. Trading runs from January 3, 1994 to June 5, 2017. Indicators use price history from before 1994 where it exists.
- Account size. Each market trades an account of 100mm in its own currency. This removes foreign exchange risk, so the markets can be compared purely on how well the strategy works in each.
Implementation
The volatility measure \(N\) is the 20-day Wilder average of the true range. One Unit is
\[\text{Unit} = \left\lfloor \frac{1\% \times \text{notional}}{N \times \text{dollars per point}} \right\rfloor\]whole contracts, using \(N\) at the prior close so that sizing does not look ahead. Units 2 to 4 are added at \(\tfrac{1}{2}N\) steps from the prior fill. The Turtle stop sits \(2N\) from the latest fill and moves up with each Unit; the Whipsaw stop sits \(\tfrac{1}{2}N\) from each Unit, with re-entry at the original trigger.
- Prices are daily open, high, low, and close for back-adjusted continuous futures.
- An order that the market gaps through fills at the open. When a bar breaks both channels, the long is taken.
- Following the Turtle rules, the notional falls 20% for each 10% drawdown and steps back up as equity recovers. Profit and loss is not compounded.
- Futures returns are excess returns, so Sharpe ratios use a zero risk-free rate. The benchmark is a fully collateralized long position in the E-mini S&P 500.
In the rest of this report, I look at the top and bottom performers, test how consistent they are, and compare correlated markets. I then combine the single markets into a composite and close with drawbacks and improvements.
2. Analysis
2.1 The best single markets are the hardest to trade
Using System 1 and the Turtle stop, 58 of the 73 markets end with a positive total return, and 33 beat the 182% total return of the E-mini over the same period. The top performers made several times their starting account (Table 1).
| Market | Currency | Total return | CAGR | Sharpe | Up years | Position / volume |
|---|---|---|---|---|---|---|
| UK Natural Gas | GBP | +1,799% | +15.6% | 1.21 | 81% | 1.31x |
| Milling Wheat | EUR | +1,259% | +15.3% | 0.98 | 84% | 7.69x |
| Palm Oil | MYR | +1,238% | +11.7% | 1.14 | 83% | 2.21x |
| Euro-Swiss | CHF | +818% | +9.9% | 0.81 | 71% | 19.60x |
| Rapeseed | EUR | +782% | +12.6% | 0.96 | 68% | 21.64x |
Table 1: Top 5 performers, System 1 with the Turtle stop, January 1994 to June 2017. “Position / volume” is the median position divided by the market’s 20-day average volume.
The ranking has a catch. In every one of the top five, the median position is larger than a full day’s average volume; in Euro-Swiss and Rapeseed, it is about 20 days’ volume. The backtest fills those orders at the quoted price, so it overstates what an account of this size could have captured. Across all markets, 17 carry a median position above daily volume.
| Market | Currency | Total return | CAGR | Sharpe | Up years | Position / volume |
|---|---|---|---|---|---|---|
| FTSE-100 | GBP | −98% | −15.7% | −0.49 | 25% | <0.01x |
| Euro Stoxx-50 | EUR | −96% | −15.6% | −0.44 | 15% | <0.01x |
| Cattle | USD | −95% | −11.8% | −0.26 | 29% | 0.17x |
| CSC New Cocoa | USD | −94% | −11.3% | −0.33 | 21% | 0.34x |
| CAC 40 | EUR | −93% | −10.8% | −0.22 | 29% | 0.01x |
Table 2: Bottom 5 performers, System 1 with the Turtle stop, January 1994 to June 2017.
Equity indexes dominate the bottom of the table: 7 of the 14 lose money, including all three US indexes. The E-mini itself, traded with the Turtle rules, loses 80% over the period while buying and holding it makes 182%: equity indexes rose slowly and fell fast, which suits a buyer and hurts a breakout trader.
2.2 Winners stay winners, but the edge halved after 2005
The top performers are consistent. Palm Oil made money in 83% of years, and its Sharpe ratio was 1.40 in 1994–2005 and 0.83 in 2006–2017. The bad performers are consistent too: FTSE-100 made money in only 25% of years and lost in both halves. Under the Turtle tactics, a market this weak would be dropped early, before it fell too far.
The consistency does not extend to the level of returns. Comparing each market’s Sharpe ratio in the two halves of the sample, 49 of 72 markets did worse after 2005, and the median market’s Sharpe fell from 0.26 to 0.11 (Figure 1).
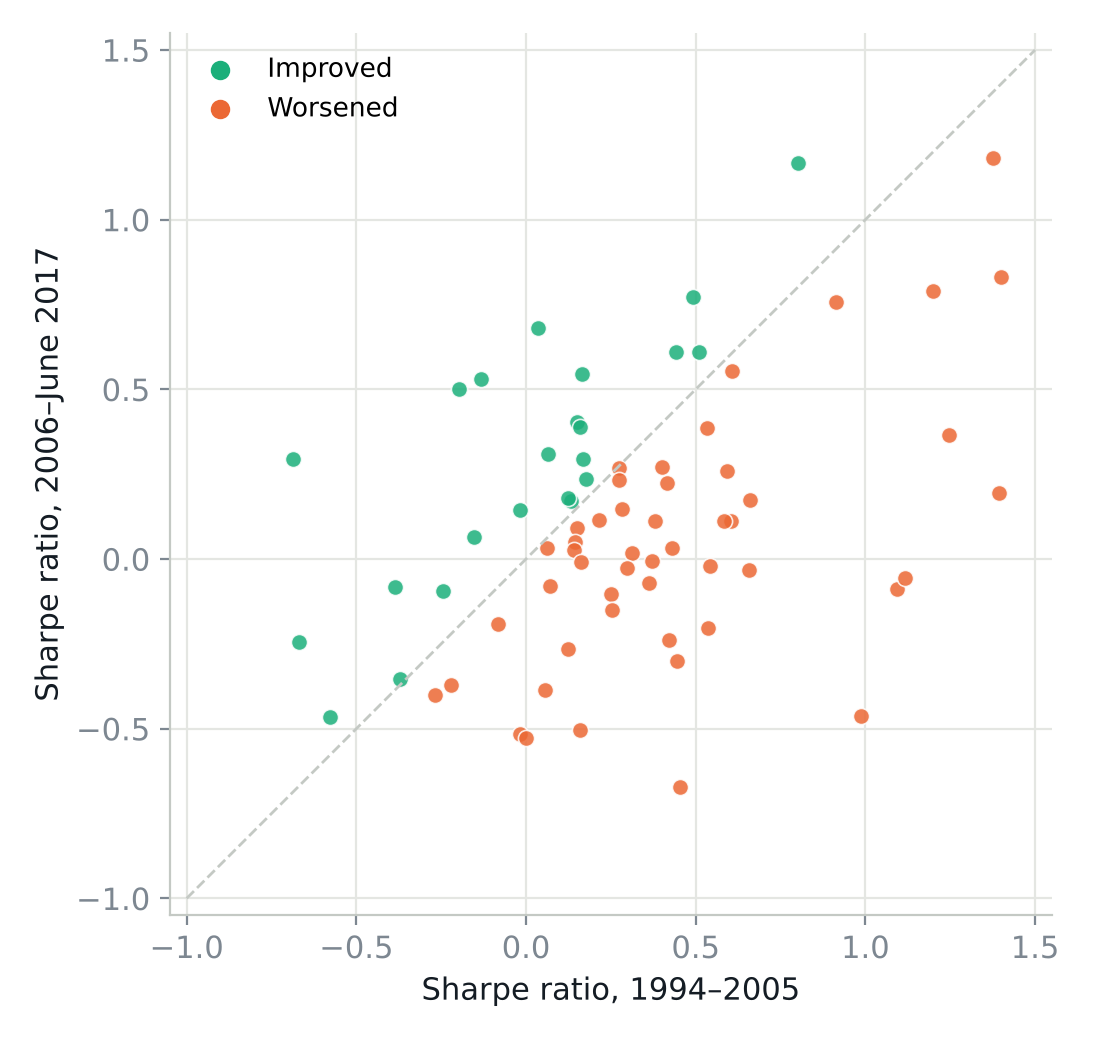 Figure 1: Sharpe ratio by market, 1994–2005 against 2006–June 2017. Markets below the diagonal (orange) did worse in the second half. Axes are clipped at −1 and 1.5; FTSE China A50 starts after 2005 and is left out.
2.3 Correlated markets diverge, but only in hindsight
The Turtles moved capital from a weak market to its stronger twin. Figure 2 shows three correlated pairs. CSC Coffee made most of its money in 1994 and drifted lower afterward, while London Coffee kept trending up. Since 2006, London Coffee has made 162% and CSC Coffee has lost 2%, even though their monthly profit and loss is correlated at 0.39; switching from CSC to London after the initial jump would have earned more. Brent Crude and Light Crude tracked each other until 2001 and then split, with Brent ending well ahead despite a 0.79 correlation, and the two German bond futures split only after 2014.
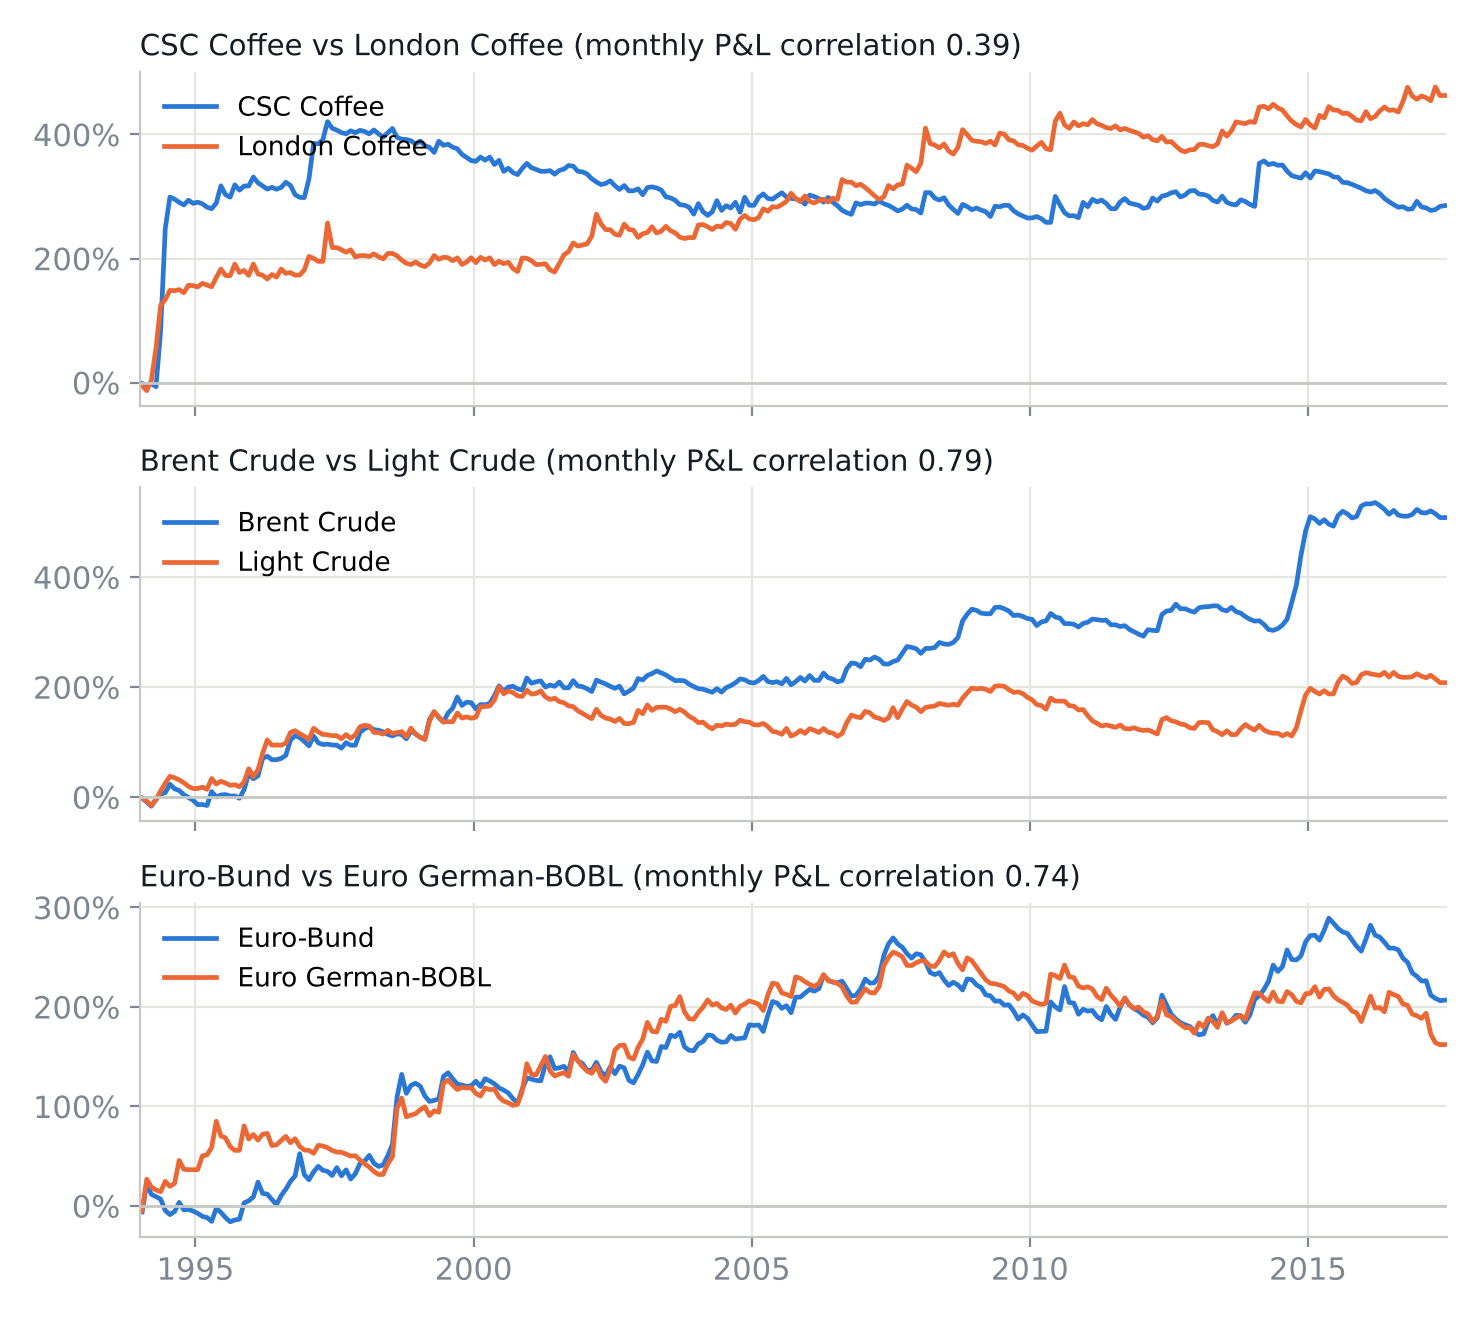 Figure 2: Cumulative return on starting capital for three correlated pairs, System 1 with the Turtle stop.
Each split, however, is visible only after the fact. These charts support the Turtle tactic of trading the stronger market, but a rule that picks the stronger twin in advance has not been tested here.
2.4 Diversification carries the strategy
Single markets are noisy: the median market has an annual volatility of 32% and a Sharpe of 0.20, and only 52% of market-years make money. Monthly profit and loss across markets, however, has an average pairwise correlation of just 0.05. Averaging the 73 markets with equal weights cuts volatility to 8.7% and lifts the Sharpe ratio to 1.26 (Figure 3).
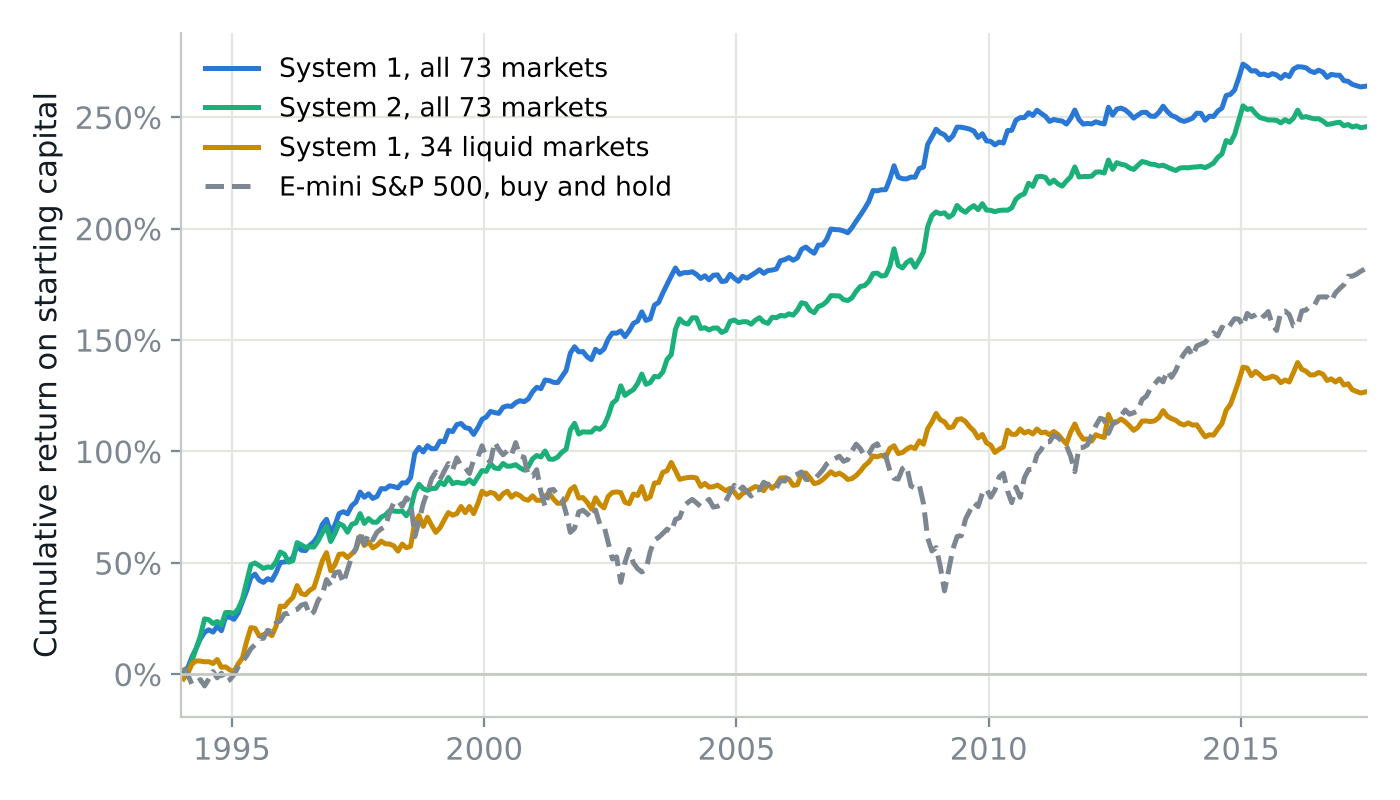 Figure 3: Cumulative return on starting capital, not compounded. Each composite averages each day’s return across the markets trading that day.
| Composite | Return p.a. | Volatility | Sharpe | 1994–2005 | 2006–2017 | Worst drawdown |
|---|---|---|---|---|---|---|
| System 1, Turtle stop | 10.9% | 8.7% | 1.26 | 1.67 | 0.79 | −13.1pp |
| System 1, Whipsaw stop | 10.8% | 8.5% | 1.27 | 1.65 | 0.84 | −11.3pp |
| System 2, Turtle stop | 10.2% | 8.5% | 1.20 | 1.45 | 0.91 | −12.3pp |
| System 2, Whipsaw stop | 10.5% | 9.0% | 1.16 | 1.44 | 0.84 | −16.2pp |
| System 1, 34 liquid markets | 5.2% | 10.0% | 0.52 | 0.68 | 0.34 | −19.5pp |
| E-mini, buy and hold | 7.7% | 18.9% | 0.41 | 0.41 | 0.41 | −77.4pp |
Table 3: Equal-weight composites, January 1994 to June 2017. Drawdowns are in percentage points of starting capital. The liquid markets are those whose median position is at most 10% of 20-day average volume.
Two results stand out in Table 3. First, the four rule sets land within 0.11 of each other in Sharpe, so the choice of markets matters far more than the choice of system. Second, restricting the composite to the 34 markets where positions stay small relative to volume cuts the Sharpe to 0.52, which confirms that much of the headline result comes from markets that are hard to trade at this size.
The composite also paid when equities crashed. In 2008, the System 1 composite made 27.2% while the E-mini lost 41.2%, and its daily correlation to the E-mini over the full period is −0.22 (Figure 4). From 2011 to June 2017, however, the composite made 10.8% in total against 83.4% for the E-mini.
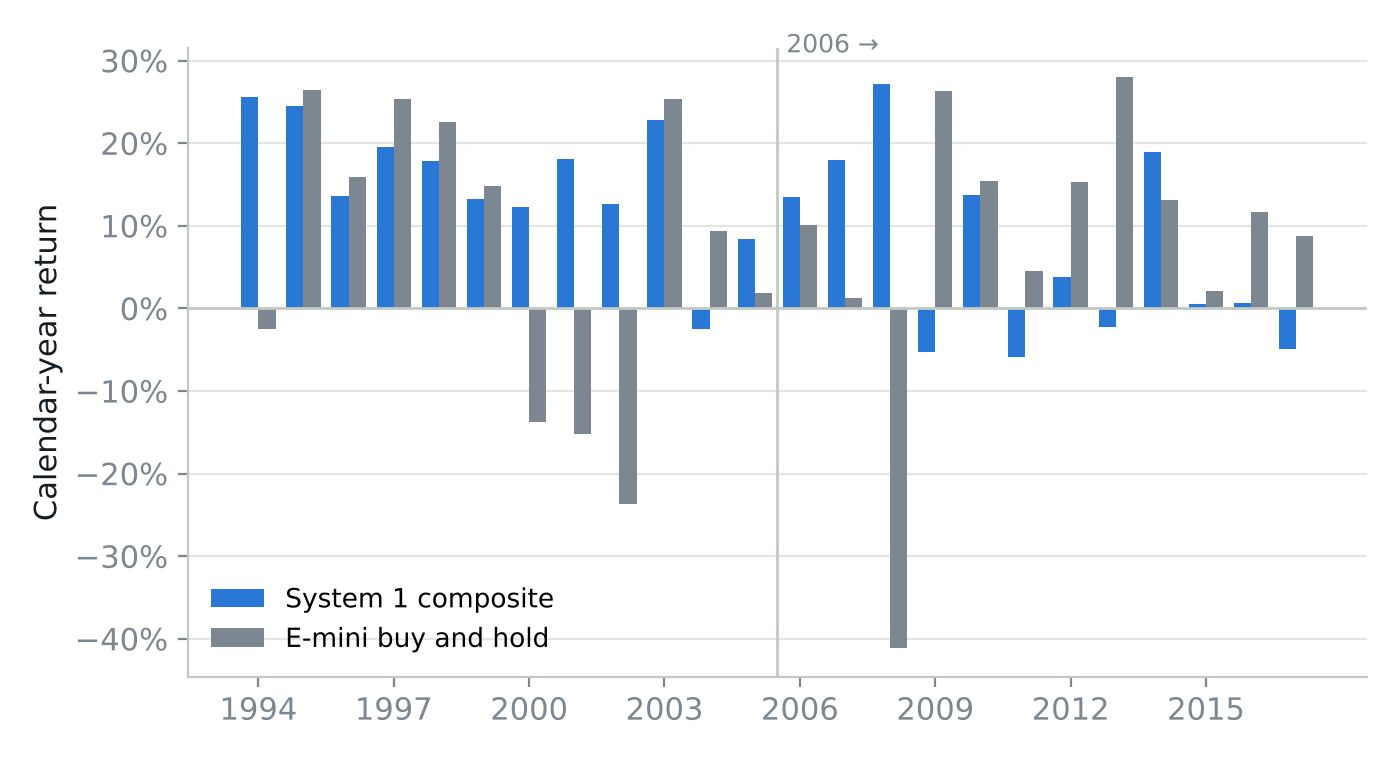 Figure 4: Calendar-year returns. 2017 runs to June 5.
2.5 Conclusion
Within the single-market framework of this report, the Original Turtle Trading Rules still work, but less well than they did, and more slowly than a backtest of the best markets suggests. In summary:
- Most single markets produce positive returns, but individually they are noisy; an equal-weight composite turns a median Sharpe of 0.20 into 1.26.
- The edge weakened after 2005: the composite Sharpe fell from 1.67 to 0.79, and two-thirds of markets did worse in the second half.
- Strong performers tend to stay strong and poor performers tend to stay poor, but the strongest are also the least liquid relative to the position size.
- Correlated markets diverge over time, which supports trading the stronger one, though only in hindsight.
3. Further Discussion
3.1 Drawbacks
- Costs. The test has no commissions, slippage, or roll costs. At about 19,500 System 1 trades across the markets, costs would cut the composite return materially.
- Capacity. Positions are not capped against volume, and volume data covers only the front contract.
- Portfolio rules. The Turtle limits of 6 Units across closely correlated markets, 10 across loosely correlated markets, and 12 in one direction are not applied; the composite is an equal-weight average of independent markets.
- System 1 skip rule. The rule to skip a breakout after a winning trade is not applied.
- Paper trading. The algorithms ran on historical data only, not on a paper trading account.
- Foreign exchange. Each market trades in its own currency, so foreign exchange risk is not tested.
- Data. Two bars have an open or close outside the high–low range; I left them as received.
3.2 Improvements
- Add the Turtle portfolio limits and test multi-market trading with a portfolio allocation strategy.
- Add transaction costs and cap positions at a share of daily volume.
- Test a rule that switches capital to the stronger of two correlated markets in advance.
- Extend the data beyond June 2017 as an out-of-sample test of whether the decay continues.
Appendix: All 73 Markets
System 1 with the Turtle stop. Returns are on an account of 100mm in each market’s own currency. A capacity flag marks a median position above 20-day average volume; Sharpe ratios for 1994–2005 and 2006–2017 show a dash where a market has no data in that half.
| Market | Ccy | Total | CAGR | Vol | Sharpe | 1994–2005 | 2006–2017 | Max DD | Trades | Win rate | Position / volume |
|---|---|---|---|---|---|---|---|---|---|---|---|
| UK Natural Gascapacity | GBP | +1,799% | +15.6% | 73% | 1.21 | 1.38 | 1.18 | −25% | 223 | 32% | 1.31x |
| Milling Wheatcapacity | EUR | +1,259% | +15.3% | 69% | 0.98 | 0.80 | 1.17 | −33% | 200 | 34% | 7.69x |
| Palm Oilcapacity | MYR | +1,238% | +11.7% | 48% | 1.14 | 1.40 | 0.83 | −17% | 239 | 33% | 2.21x |
| Euro-Swisscapacity | CHF | +818% | +9.9% | 42% | 0.81 | 1.39 | 0.19 | −21% | 267 | 27% | 19.60x |
| Rapeseedcapacity | EUR | +782% | +12.6% | 44% | 0.96 | 1.20 | 0.79 | −41% | 210 | 31% | 21.64x |
| London White Sugar #5capacity | USD | +777% | +9.7% | 39% | 0.85 | 1.25 | 0.36 | −20% | 268 | 27% | 3.87x |
| Live Hogs | USD | +666% | +9.1% | 34% | 0.84 | 0.91 | 0.76 | −21% | 252 | 34% | 0.72x |
| Brent Crude | USD | +508% | +8.0% | 34% | 0.62 | 0.49 | 0.77 | −35% | 262 | 31% | 0.03x |
| London Coffeecapacity | USD | +463% | +7.7% | 42% | 0.47 | 0.53 | 0.39 | −26% | 267 | 31% | 1.76x |
| 3M EURIBOR | EUR | +455% | +7.6% | 32% | 0.60 | 1.09 | −0.09 | −31% | 266 | 27% | 0.38x |
| Feeder Cattlecapacity | USD | +450% | +7.5% | 34% | 0.56 | 0.51 | 0.61 | −44% | 264 | 30% | 3.28x |
| Gasoil | USD | +450% | +7.5% | 33% | 0.58 | 0.61 | 0.55 | −37% | 272 | 31% | 0.07x |
| Palladiumcapacity | USD | +438% | +7.4% | 45% | 0.41 | 0.60 | 0.11 | −53% | 276 | 25% | 3.94x |
| Canola Canadacapacity | USD | +433% | +7.4% | 36% | 0.52 | 0.44 | 0.61 | −41% | 262 | 25% | 4.46x |
| Japanese Yen | USD | +352% | +6.7% | 34% | 0.44 | 0.66 | 0.17 | −25% | 266 | 25% | 0.05x |
| SGX CNX Nifty | USD | +329% | +9.2% | 44% | 0.45 | 1.12 | −0.06 | −25% | 215 | 25% | 0.51x |
| Japan Govt Bond | JPY | +320% | +6.3% | 32% | 0.44 | 0.59 | 0.26 | −30% | 268 | 25% | <0.01x |
| Eurodollar 3M | USD | +314% | +6.3% | 34% | 0.40 | 0.99 | −0.46 | −33% | 266 | 26% | 0.15x |
| New Zealand Dollarcapacity | USD | +312% | +7.3% | 44% | 0.35 | 0.66 | −0.03 | −34% | 247 | 23% | 1.47x |
| CSC Coffee | USD | +285% | +5.9% | 52% | 0.24 | 0.37 | −0.01 | −33% | 298 | 23% | 0.22x |
| Sugar #11 | USD | +279% | +5.9% | 31% | 0.39 | 0.04 | 0.68 | −62% | 272 | 26% | 0.35x |
| Short Sterling 3mcapacity | GBP | +279% | +5.9% | 32% | 0.37 | 0.58 | 0.11 | −38% | 265 | 26% | 1.15x |
| Kansas Wheatcapacity | USD | +278% | +5.8% | 37% | 0.32 | 0.41 | 0.23 | −35% | 286 | 26% | 1.04x |
| Soybean Meal | USD | +264% | +5.7% | 31% | 0.37 | 0.17 | 0.55 | −47% | 281 | 26% | 0.24x |
| Corn | USD | +262% | +5.6% | 33% | 0.34 | 0.40 | 0.27 | −38% | 269 | 26% | 0.08x |
| Cotton | USD | +220% | +5.1% | 34% | 0.27 | 0.15 | 0.40 | −56% | 280 | 24% | 0.51x |
| Light Crude | USD | +208% | +4.9% | 33% | 0.27 | 0.27 | 0.27 | −33% | 271 | 28% | 0.02x |
| Australian 90-Day Bank Billscapacity | AUD | +207% | +4.9% | 40% | 0.22 | 0.28 | 0.15 | −38% | 299 | 25% | 13.17x |
| Euro-Bund | EUR | +207% | +4.9% | 31% | 0.29 | 0.54 | −0.02 | −39% | 268 | 29% | <0.01x |
| TOPIX | JPY | +199% | +4.8% | 34% | 0.25 | 0.27 | 0.23 | −51% | 259 | 24% | <0.01x |
| Soybean | USD | +199% | +4.8% | 30% | 0.28 | 0.16 | 0.39 | −57% | 275 | 28% | 0.04x |
| Natural Gas | USD | +194% | +4.7% | 41% | 0.20 | 0.36 | −0.07 | −31% | 284 | 28% | 0.03x |
| DAX | EUR | +189% | +4.6% | 33% | 0.24 | 0.43 | 0.03 | −38% | 275 | 27% | 0.01x |
| Euro German-BOBL | EUR | +162% | +4.2% | 31% | 0.22 | 0.54 | −0.20 | −33% | 275 | 26% | 0.03x |
| Canadian Govt Bond | CAD | +154% | +4.1% | 32% | 0.20 | 0.18 | 0.24 | −39% | 275 | 27% | 0.34x |
| Euro-Schatz | EUR | +154% | +4.7% | 32% | 0.24 | 0.38 | 0.11 | −37% | 238 | 26% | 0.08x |
| Euro-FX | USD | +152% | +4.0% | 28% | 0.23 | 0.17 | 0.29 | −53% | 264 | 26% | 0.02x |
| Copper | USD | +152% | +4.0% | 28% | 0.23 | −0.13 | 0.53 | −70% | 270 | 27% | 0.18x |
| Nikkei-225 | JPY | +151% | +4.0% | 34% | 0.19 | 0.06 | 0.31 | −64% | 270 | 26% | <0.01x |
| London Cocoacapacity | GBP | +131% | +3.6% | 32% | 0.17 | 0.31 | 0.02 | −47% | 294 | 25% | 2.56x |
| Swiss Market Index | CHF | +114% | +3.3% | 38% | 0.13 | 0.45 | −0.30 | −54% | 297 | 23% | 0.14x |
| Australian Dollar | USD | +112% | +3.3% | 29% | 0.16 | 0.22 | 0.11 | −45% | 277 | 25% | 0.18x |
| UK Gilts | GBP | +110% | +3.2% | 31% | 0.15 | 0.13 | 0.17 | −35% | 282 | 25% | 0.06x |
| Heating Oil | USD | +110% | +3.2% | 32% | 0.15 | 0.12 | 0.18 | −52% | 290 | 26% | 0.06x |
| 10Y T-Notes | USD | +101% | +3.0% | 30% | 0.14 | 0.30 | −0.03 | −44% | 267 | 28% | <0.01x |
| Silver | USD | +90% | +2.8% | 24% | 0.16 | −0.20 | 0.50 | −68% | 261 | 28% | 0.06x |
| Unleaded Gasoline | USD | +90% | +2.8% | 31% | 0.12 | 0.15 | 0.09 | −49% | 287 | 26% | 0.06x |
| Swiss Franc | USD | +85% | +2.6% | 30% | 0.12 | 0.42 | −0.24 | −47% | 277 | 26% | 0.12x |
| US $ Indexcapacity | USD | +70% | +2.3% | 30% | 0.10 | 0.14 | 0.05 | −48% | 282 | 25% | 1.21x |
| US T-Bonds | USD | +60% | +2.0% | 30% | 0.09 | 0.14 | 0.03 | −41% | 273 | 26% | 0.01x |
| 5Y T-Notes | USD | +59% | +2.0% | 31% | 0.08 | 0.25 | −0.10 | −57% | 274 | 24% | 0.03x |
| Hang Seng Index | HKD | +58% | +2.0% | 34% | 0.08 | 0.16 | −0.01 | −57% | 284 | 24% | <0.01x |
| Canadian Dollar | USD | +44% | +1.6% | 28% | 0.07 | 0.25 | −0.15 | −67% | 269 | 20% | 0.18x |
| Lumbercapacity | USD | +43% | +1.6% | 30% | 0.06 | −0.02 | 0.14 | −62% | 298 | 24% | 6.73x |
| Soybean Oil | USD | +30% | +1.1% | 27% | 0.05 | 0.06 | 0.03 | −55% | 287 | 24% | 0.35x |
| FTSE China A50 | USD | +29% | +4.0% | 32% | 0.14 | – | 0.14 | −39% | 78 | 17% | 0.28x |
| 2Y T-Notes | USD | +5% | +0.2% | 32% | 0.01 | 0.45 | −0.67 | −67% | 287 | 23% | 0.21x |
| CMX Gold | USD | +4% | +0.2% | 35% | 0.00 | 0.07 | −0.08 | −63% | 284 | 25% | 0.07x |
| Wheat | USD | −33% | −1.7% | 23% | −0.06 | −0.15 | 0.06 | −76% | 288 | 23% | 0.09x |
| Mexican Peso | USD | −33% | −1.8% | 31% | −0.05 | 0.12 | −0.27 | −74% | 266 | 24% | 0.55x |
| Platinum | USD | −59% | −3.7% | 10% | −0.25 | −0.69 | 0.29 | −91% | 280 | 23% | 0.38x |
| Pound Sterling | USD | −61% | −3.9% | 20% | −0.13 | −0.08 | −0.19 | −67% | 277 | 21% | 0.06x |
| Nasdaq E-mini | USD | −63% | −5.5% | 16% | −0.22 | −0.39 | −0.08 | −80% | 223 | 26% | <0.01x |
| MSCI Taiwan | USD | −69% | −5.6% | 29% | −0.12 | 0.06 | −0.38 | −85% | 252 | 25% | 0.13x |
| E-mini | USD | −80% | −6.6% | 24% | −0.14 | −0.02 | −0.52 | −90% | 286 | 24% | <0.01x |
| mini Russell 2000 | USD | −81% | −10.1% | 22% | −0.24 | 0.16 | −0.50 | −87% | 194 | 23% | 0.01x |
| Australian 3Y Bond | AUD | −82% | −7.1% | 19% | −0.19 | −0.24 | −0.10 | −87% | 288 | 23% | 0.06x |
| Australian 10Y Bond | AUD | −84% | −7.5% | 29% | −0.12 | 0.00 | −0.53 | −94% | 304 | 19% | 0.09x |
| CAC 40 | EUR | −93% | −10.8% | 18% | −0.22 | −0.22 | −0.37 | −95% | 306 | 20% | 0.01x |
| CSC New Cocoa | USD | −94% | −11.3% | 12% | −0.33 | −0.37 | −0.35 | −95% | 307 | 22% | 0.34x |
| Cattle | USD | −95% | −11.8% | 16% | −0.26 | −0.27 | −0.40 | −98% | 293 | 17% | 0.17x |
| Euro Stoxx-50 | EUR | −96% | −15.6% | 11% | −0.44 | −0.58 | −0.47 | −97% | 245 | 19% | <0.01x |
| FTSE-100 | GBP | −98% | −15.7% | 8% | −0.49 | −0.67 | −0.25 | −99% | 300 | 19% | <0.01x |
Showing 73 of 73 markets. Click a column to sort.
Source: The Original Turtle Trading Rules, originalturtles.org. The views here are my own and do not represent those of my employer. Nothing here is investment advice.